A "Simple" Grid Trading Strategy That Works
Do you want a "lossless" trading strategy?
Then most likely you are thinking about grid trading.
Many people are drawn to grid trading because of how easy it is to trade and profit from the market.
No need to guess where the market is going...
No need for technical analysis or watching chart patterns...
And there is no need to recognize candle patterns or have any indicators.
All you have to do is just buy and sell at fixed intervals and then NOT put a stop loss, right?
Not really.
If you don't have unlimited funds, this will wipe out your account faster than you can say "grid trading".
So can grid trading really work?
Could it be beneficial?
In this section, I will explain in detail what grid trading is...
Wrong way to use...
And the correct, safe way to use this strategy.
What is network trading
It is simply dividing the market into many levels and placing buy and sell orders at each level.
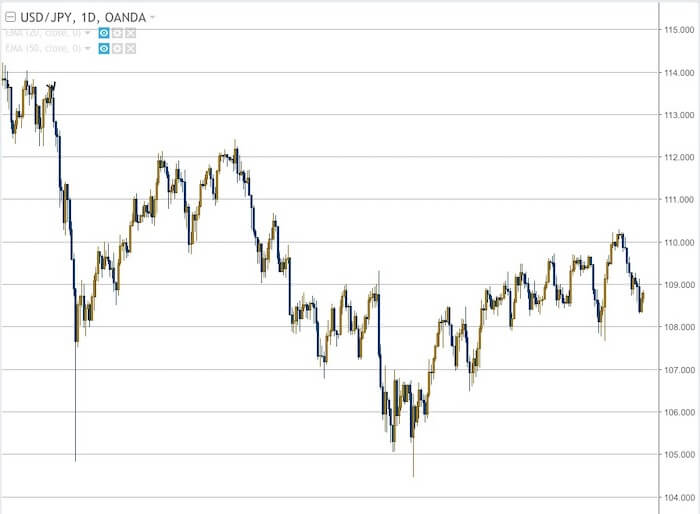
The chart above shows the USDJPY pair.
As you can see, I divided the chart into levels with an interval of 100 points.
This means that each level is 100 points apart from each other.
Therefore, network traders usually buy and sell at each level, and then take profits at every other interval.
On the left side of the chart, you can see that USDJPY is trading at 114.00.
Thus, network traders will go long and short at 114.00 at the same time.
Then, when the market drops to 113.00, they will take profit on their short position at 114.00 for a 100 pip profit...
And they will keep their long position at 114.00.
They will then go long and short again at 113.00.
So, at the moment they will have the following current positions:
Long position at 114.00
Long position at 113.00
Short position 113.00
When the market returns to 114.00 they sell their long position at 113.00 for a 100 pips profit...
And then again open a long and short position at 114.00.
So, at the moment their current positions are:
Long position at 114.00
Short at 114.00
What happened here was that they returned to their original position.
The only difference is that they have already made two profits of 100 pips.
Then when the market drops to 105.00, as you can see on the chart, they collect all the longs and take profits on their shorts on the way down.
So, at 105.00 they will have the following positions:
Long position at 114.00
Long position at 113.00
Long position at 112.00
Long position at 111.00
Long position at 110.00
Long position at 109.00
Long position at 108.00
Long position at 107.00
Long position at 106.00
Long position at 105.00
Short position at 105.00
Then, as the market rises, they close out their long positions one by one and add to their short positions.
This is what a typical grid trading strategy looks like.
However, this is a very dangerous strategy.
And that's why.
With this type of grid trading strategy, there is usually no stop loss.
And since there is no stop loss, network traders do not expect losses.
For example, they calculated their risk at which their deposit would only be liquidated if the market moved X levels against them.
Let's take 20 levels as an example.
Many network traders mistakenly believe that the market cannot go against their positions for 20 levels in a row without rising at least one level.
Thus, they double their positions as the market moves against them.
This is called the martingale strategy.
And all they want is for the market to just go one level in their direction and they can take profits.
But according to Murphy's Law, anything that can go wrong will go wrong.
This is why most traders who use a grid trading strategy inevitably end up liquidating their deposit.
But that's only because they're doing it wrong.
Why network trading?
The main reason why many people are lured into network trading is because it is formulated as a "lossless" strategy.
You simply place your orders at each level and when the price hits the take profit level, you make money.
You only lose when you run out of money to hold losing positions as the market goes against you.
In a way, this is similar to an all-or-nothing trading strategy.
And I wouldn't even call it a "trading strategy"...
It's more like gambling.
So what traders will do is test this type of strategy on historical data and just fit it to the data.
This will cause their backtest to show zero losses.
And so they think they've found the "holy grail" trading strategy.
But it is almost inevitable that traders trading this way will lose their accounts when trading live.
How do I know this?
I used to be one of those traders.
Back in 2017, I extensively researched and tested these types of network trading strategies, and many of them looked great when backtested.
The graph showed a constant increase in profits.
But when I traded these strategies live, some of them could run for over a year before one big move in the market wiped out my account...
Some of them only worked for a few months.
The dangers of online trading
The trading strategy that I just shared with you above is a very dangerous trading strategy that will inevitably lead to the collapse of your trading account.
For example, if the market keeps moving in the same direction and you just average your positions, there will come a point where you will run out of money.
And this is where you will lose all your profits and even more.
In addition, many traders are attracted to grid trading because you can make a profit quickly.
Therefore, when trading with such a strategy, traders only focus on how much they can earn.
Instead of defining the worst case scenario, they focus on how much money can be made at each take profit level.
Here is an example...
Let's say you decide to create a 10 pip grid trading strategy and have allocated $1,000 capital to trade it.
For this strategy, you have decided that you will go both long and short at each level.
Instead of calculating a cutoff point based on how much capital you have, you focus on how much you can make on each 10 pip take profit.
So you decide it's a fixed dollar amount.
You decide that every time you take profits, you want to make $10.
This means that each 10 pip take profit level will net you $10.
So if you just reach the take profit level ten times a day, you will earn $100.
To do this, you calculate that your position size is 0.10 lots.
At the end of five trading days, you realized that you were making $100 every day.
Everything looks fantastic and promising.
Your total trading capital is currently $1,500.
You just made 50% of your capital in 5 days and you think trading is easy.
Then, on the sixth trading day, the market began to move strongly in one direction, and did not change it any more.
It just kept moving in one direction until you ran out of money to fund new levels and your open loss on your positions wiped out your trading account.
This is why grid trading is very dangerous.
This is because traders do not calculate their maximum risk.
They only think about how much they can earn.
To make matters worse, aggressive network traders will use the martingale strategy.
This means that as the market goes against their positions, they will increase their positions as the market goes against them.
This can be very dangerous if you don't know exactly what your drawdown will be at each level.
Most traders who use a grid trading strategy are not even aware of it.
Therefore, they do not know exactly at what level they will run out of capital.
If you want to trade on a grid, you must know exactly what your risk is at each level...
And you also have to know exactly where the maximum cutoff point is before your account goes to zero.
How to build a secure online trading strategy
So, now that we know about the dangers of online trading, the question is:
Is it possible to build a secure network trading strategy that guarantees no losses and will stand the test of time, no matter how big the market moves?
The answer is yes.
But there are several criteria for this:
· This will be a grid trading strategy for long positions only.
· Trade an asset that has a very low probability of resetting.
· A minimum interest rate should be charged for daily holding of positions.
· You must have the funds to hold all your positions to zero.
With these criteria, we have a solid grid trading strategy that will stand the test of time and not lose money...
Except, of course, the case when the asset is reset to zero.
So, the reason we want this to be a long-only strategy is so that we know where the absolute cutoff point is...
And we can calculate our exact risk when it reaches zero.
When using short positions, there is no limit to how high the market can rise, so we cannot know where the cut-off point is.
So the key to making this network trading strategy work is your risk management.
In trading, risk management is very important.
In grid trading, risk management is everything.
Because if you miscalculate your risk, your account can be easily destroyed.
But if you manage your risk properly, the profit will take care of itself.
The idea is to simply buy when the market is down and then take profits when it is up.
So, there are a few important elements to consider when building this network trading strategy:
Number of levels
· Order size of each level
distance between levels
・Take profit fixing strategy
Number of levels
How many levels are you planning to have?
The more levels, the more transactions are made.
The more often you make trades, the more often you can take profits.
But there is a compromise.
The tradeoff is that if you want to maintain the same maximum nominal risk for the entire grid, then there will be a smaller position size at each level.
For example, a grid of 10 levels might have a position size of 0.10 lots at each level.
But a 20 level grid should have a smaller position size for each level to maintain maximum risk for the entire grid structure.
Thus, if the market falls to zero, both grid structures will lose the same amount.
If you want to maintain the same size for every level, no matter how many levels there are, then your maximum damage will increase as the number of levels increases.
So that's a compromise you want to balance with more levels.
Trade size at each level
What is the position size of each level?
Will it be evenly distributed across all levels?
Or will it increase as the market falls?
There are many ways to structure the position size of your grid levels.
In general, there are two types of position sizing strategies:
· Anti-martingale
Martingale
An anti-martingale is when you charge a fixed percentage or a fixed lot size per trade.
So if your capital is $10,000, you can risk 2 percent of your capital on each trade, or a fixed lot size of 0.10 per trade.
But with a martingale position sizing strategy, you will increase your size as the market moves against you.
Usually, using the martingale strategy is very dangerous.
However, there is only one scenario where the martingale strategy can be safe and profitable in the long run...
And it is this strategy that I am sharing with you here.
This is because you can only lose your money if the market drops to zero.
Until this happens, you can continue to increase your position as the market falls.
And that is why it is important to choose the right asset to trade with this strategy.
But of course, you MUST also know what your maximum risk is if the market drops to zero.
In this way, you will indeed have enough capital to maintain the entire grid structure at all times.
Distance between levels
How far from each level?
Will it be every 250 points, 100 points, 50 points?
The distance should be balanced with the number of levels in your grid.
If you have more levels, you can decrease the distance between them.
But if you have smaller levels, then you will have more distance between each level.
Profit strategy
How will you make a profit?
Will you take profits at every single level interval?
Or will there be many levels?
Or will you take profits at fixed price levels?
There are many ways to take profits with a grid strategy.
Putting it all together
So here is a simple grid trading strategy that I was inspired to build when I read The Profitable Art And Science of Vibratrading by Mark Andrew Lim.
In his book, he describes a grid trading strategy that works like a long-term strategy and will not result in a loss of money unless the market drops to zero.
There are a few important things you need to know about this grid trading strategy:
· This is a strategy for long positions only.
· This is a long-term strategy.
· Works on futures contracts.
· It is necessary to conduct a thorough analysis of the chosen instrument.
We choose BTCUSDT as the most stable and liquid asset in the crypto currency market.
I analyzed the volatility of the asset and important support levels. Since the beginning of the year, $30,000 has been a strong support level. Let's take $27,000 as the zero point, this gives us a buffer 10% below the support. In the event that the price falls below $27,000, we will no longer add any positions and will simply hold the trade until it returns or drops to zero. So we completed the first task - we determined the conditions for the complete collapse of the deposit. Now you need to optimize the grid to get the maximum profit from a particular instrument. BTC has a fairly understandable nature of movements, so with every sharp strait, there is the same sharp rebound. It is precisely these moments that are the most dangerous, but also the most profitable, so you need to evaluate these movements carefully enough and calculate the grid parameters for stable and profitable work.
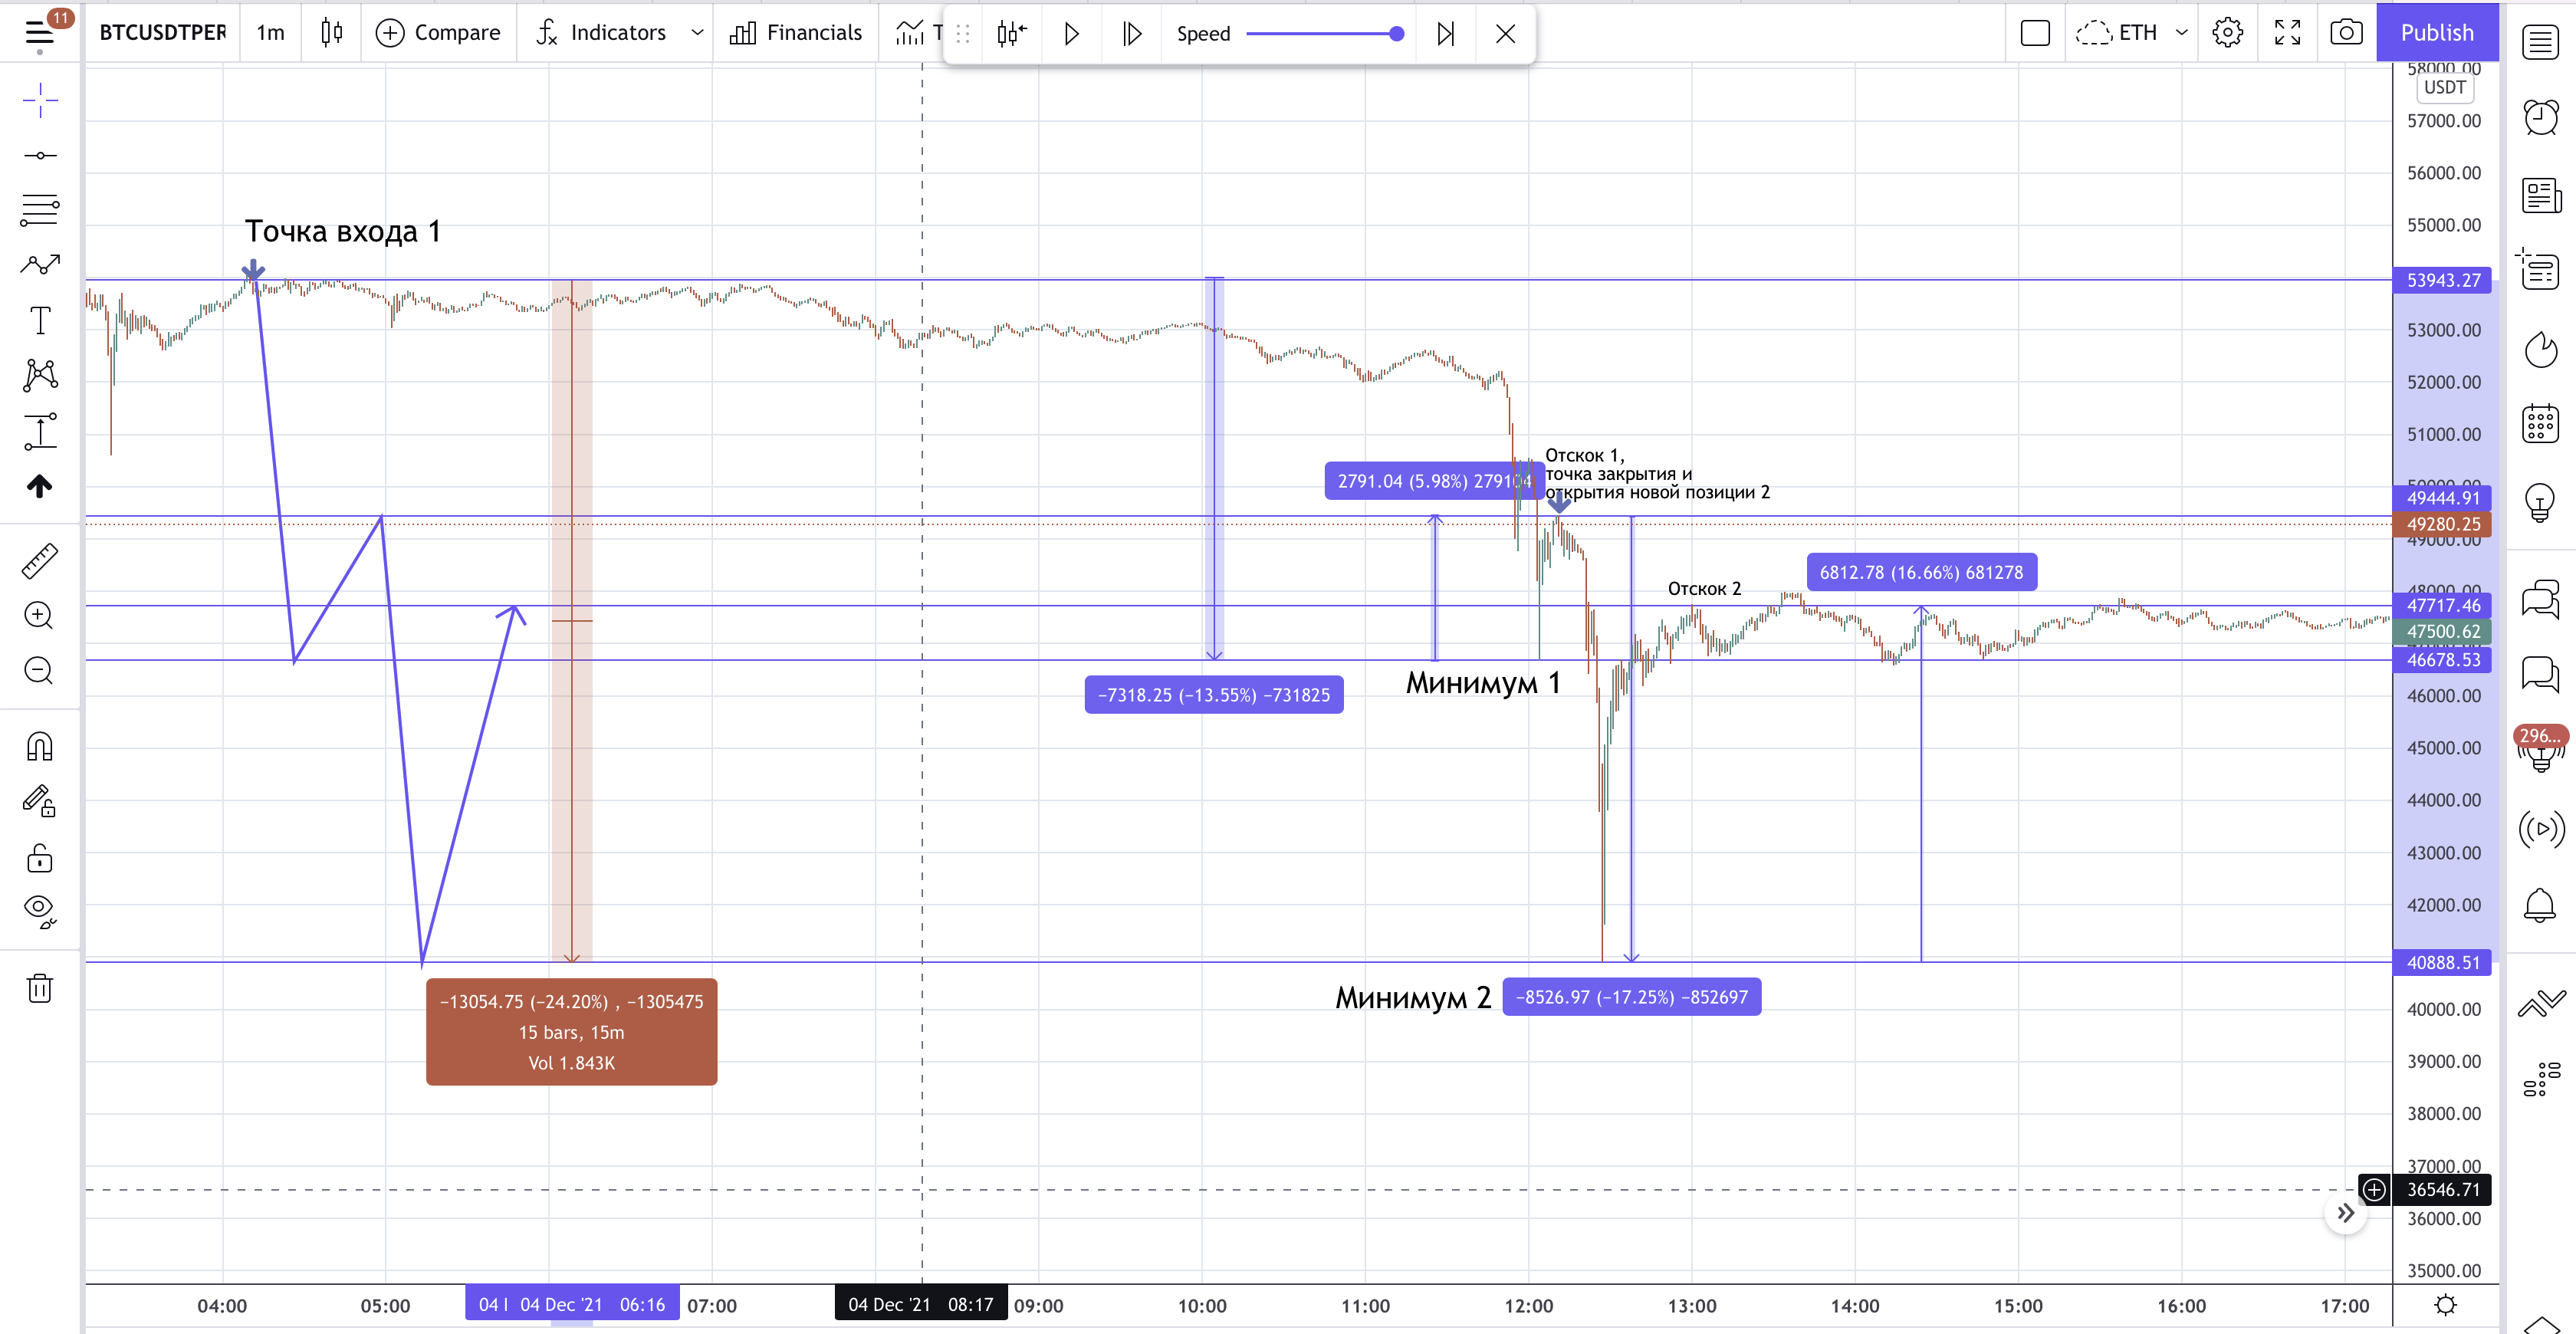
Let's consider the work of the grid on the example of a strong correction on 04.12.21.
The correction of the BTCUSDT asset on the Binance exchange amounted to 24.20%, while, as we can see on the 1-minute chart, for the grid this correction consisted of two parts.
The first part is a 13.55% fall and a 5.98% rebound, the second part is a 17.25% fall and a 16.66% rebound. Thus, the maximum drawdown for the grid was not 24.20%, but 17.25%. From here it should be understood that although this asset is capable of very sharp drops, it still reacts to levels of liquidity accumulation and tends to good rebounds. At the same time, sharp corrections happen quite rarely. Most of the time, the asset has a volatility of around 10-12%.
For a more accurate analysis, it is worth considering the strongest and sharpest corrections of a particular asset.
Now consider the grid table and its optimization option.
First Entry Point: 50000 USDT
Deposit: 50000 USDT
Number of levels: 20
Distance to level: 2%
Position size: fixed lot 0.001 BTC per level.
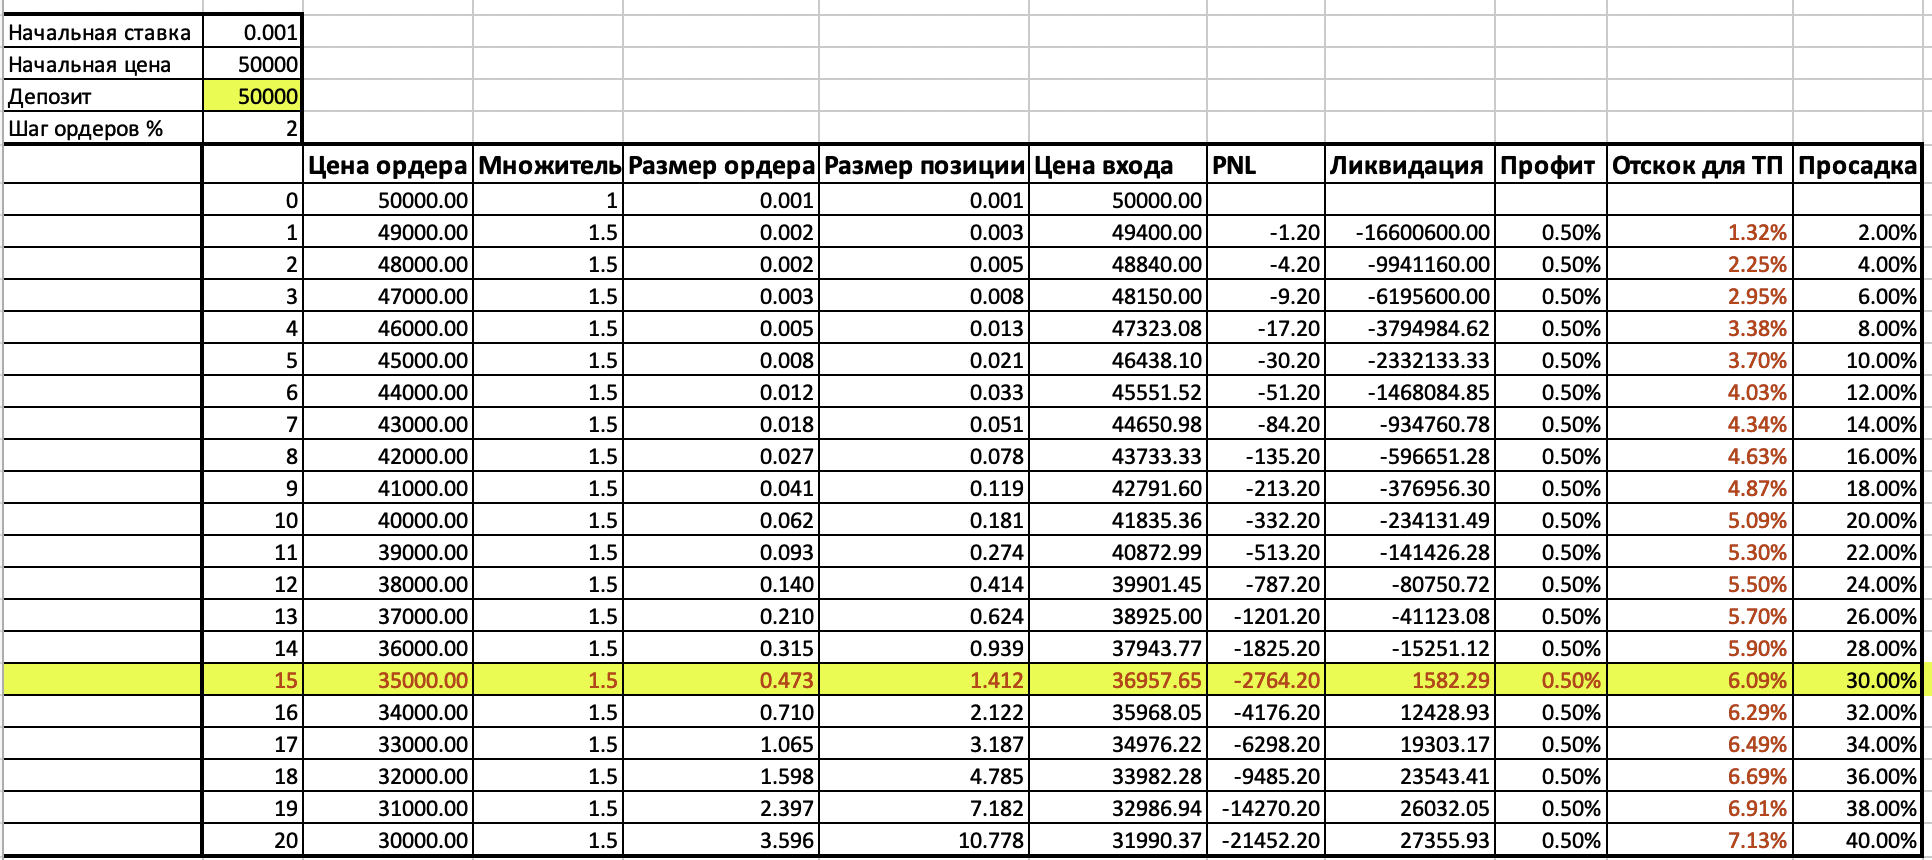
What can we understand from this structure?
1. To close the take profit at any level, we need a rebound of no more than 6%.
2. If we stop gaining a position at the 30% retracement level, the liquidation price will remain at 1582USDT, which, as we understand it, is a very unlikely level for the asset in question. If we continue to gain position to the 40% retracement level, then the liquidation level will sharply approach our absolute zero level, and will be 27355USDT, which, although an unlikely scenario, is still possible.
3. The profit of this grid compared to the size of the deposit will be very modest, since the bet size is only 0.001 BTC. At the same time, up to the level of 30% drawdown, about 3000USDT will be involved. It is also noteworthy that for an average volatility of 10-12%, a deposit equal to only 51USDT will be involved.
Conclusions for optimization:
1. Stick to the rebound level after the 3-7% correction;
2. Determine the level of averaging stop at the level of 30% correction, take the level of absolute 0 based on the analysis of the chart <25000USDT;
3. Decrease the size of the deposit or increase the size of the entry into the position, depending on the actual size of the deposit.
Optimize grid parameters to maximize profit for accepted risks.
So what do we end up with:
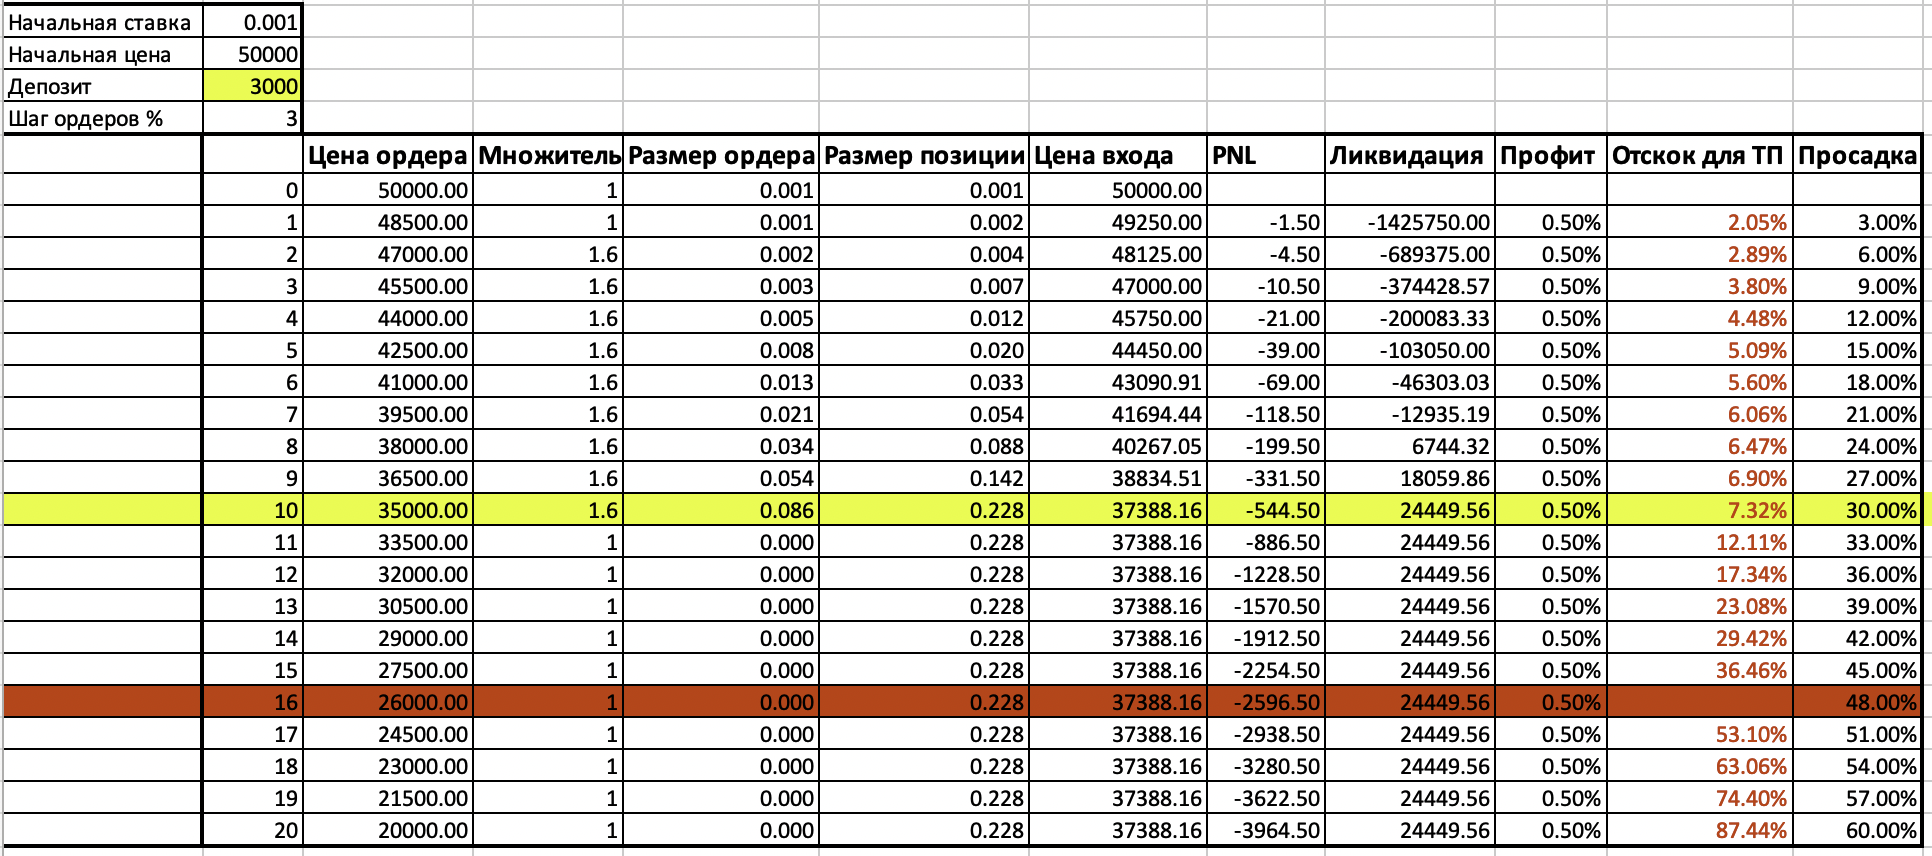
1. To close the take profit at any level, we need a rebound no more than 7.32%.
2. If we stop gaining position at the 30% retracement level, the liquidation price will remain at 24449USDT, which is about 50% retracement without a bounce, which we understand is a very unlikely level for the asset in question.
3. The profit of the grid compared to the size of the deposit has become much larger, since the bet size has remained the same - 0.001 BTC. At the same time, up to the level of 30% drawdown, 544USDT will be involved, the rest of the deposit will maintain the margin to the level of absolute zero.
4. The grid has become significantly shorter as we have optimized the step size between orders and the position multiplier at each step.
The considered grid is not a working strategy, but only shows how important it is to analyze the behavior of a particular asset and establish optimal risks in order to have a stable profit without liquidations. You can create grids with a high liquidation risk, but with a possible profit of more than 100% per month, or you can set the risks to 0 and see what profit such a grid will bring.
However, my choice is to optimize the grid parameters based on the behavior of a particular asset.
conclusions
By now, you should understand that grid trading is not exactly what many people think it is.
If you need a grid trading strategy that can quickly double or triple your trading account…
Then you should be prepared for the fact that Murphy's law will work and destroy your trading account.
But if you don't mind a slow and steady network trading strategy that is guaranteed to be profitable in the long run...
Then you should analyze the asset and carefully optimize the grid parameters.
All questions regarding the work of the grid bot, ask in the telegram chat - https://t.me/GridBotCrypto